
When you look at Vocal Spectrum during practice, the bars feel like they should sit exactly on the harmonics you are singing. They do not — not because the graph is “wrong,” but because the tool draws FFT bins on a log frequency axis, not a physics textbook list of overtone frequencies. This article uses four reproducible WAV files (220 Hz fundamental, known harmonic levels) to answer one question: where do those harmonics actually show up on upload, and when does the PEAK readout disagree with the note you think you sang?
The tones are not a voice. They are three-second, 48 kHz, 16-bit mono signals with 20 ms fades, the same family as the quiet level ladder and Pitch gate upload test. We generated them with scripts/make_spectrum_harmonic_fixture_wavs.py and simulated the upload analysis path in analyze_uploaded_file (2048-point FFT, Hann window, 25 ms hop) as implemented in the site code. Numbers below come from harmonic-fixture-results.json.
Download WAV (upload from Vocal Pitch Monitor or Vocal Spectrum, then scrub playback to the steady middle):
balanced (1.0 / 0.35 / 0.15) · strong 2nd · weak fundamental · 2nd dominant
What the tool is actually plotting
Vocal Spectrum shows short-window FFT magnitude in dBFS. Each vertical bar (in Bar mode) is the maximum dB among the raw FFT bins that fall inside that bar’s log-spaced frequency interval between your Low and High settings. The four chips above the graph summarize the current frame inside the same band after the Spectrum floor (sensitivity) filter:
- PEAK — frequency label of the single strongest bin in the band (not a sub-bin interpolation).
- LEVEL — that bin’s dBFS.
- CENTROID — amplitude-weighted mean frequency of bins above the floor.
- RMS — root mean square of linear amplitudes of those bins; not loudness in LUFS or SPL.
That definition matters for harmonics. A pure 440 Hz sine would still be reported at the center frequency of whichever FFT bin won, which is spaced every Δf = sample_rate / FFT_size on the upload path. For 48 kHz and a 2048-point transform, Δf ≈ 23.44 Hz, so bin centers step 222.66 Hz, 246.09 Hz, 269.53 Hz, … — not “every harmonic of 220 Hz.”
Live microphone analysis uses the browser AnalyserNode at 4096 FFT size (finer bins, ~11.72 Hz at 48 kHz). Uploaded takes stored for replay use the 2048 pipeline above. Comparing a mic screenshot to an uploaded WAV without noticing that split will look like a disagreement even on the same tone.
For background on reading the graph in practice, see What Is the Vocal Spectrum and PEAK, LEVEL, CENTROID, RMS. Pitch tracking is a separate path; use Vocal Pitch Monitor for note accuracy, not PEAK alone.
Four fixtures: same pitch, different harmonic balance
All four files share F0 = 220 Hz (A3 at A4 = 440 Hz). Relative harmonic amplitudes before normalization:
| Fixture | 1× (220 Hz) | 2× (440 Hz) | 3× (660 Hz) |
|---|---|---|---|
| balanced-h2-h3 | 1.00 | 0.35 | 0.15 |
| strong-second | 1.00 | 0.95 | 0.12 |
| weak-fundamental | 0.25 | 1.00 | 0.35 |
| second-dominant | 0.08 | 1.00 | 0.22 |
Peak sample value is 0.4 full scale in each file. Only the first three harmonics are in the waveform; there is no energy at 880 Hz in the generator, so energy near 880 Hz in the table is leakage and noise floor, not a fourth harmonic we added.
We analyzed the middle analysis frame of each upload (after the same 0.8/0.2 temporal smoothing used during file import). Default stats band 80 Hz–16 kHz and default sensitivity (~50% slider position, floor about −37.9 dBFS) match a fresh Vocal Spectrum panel unless you changed Low–High or Spectrum floor.
Where harmonics land in FFT bins (upload path)
True harmonic frequencies are exact multiples: 220, 440, 660, 880 Hz. Each bin is labeled at its center frequency: (bin index + ½) × 23.4375 Hz at 48 kHz upload analysis. The table lists, for each harmonic, the strongest bin within ±2 neighbors of the expected index.
| Fixture | H1 target 220 Hz → bin center (dBFS) | H2 target 440 Hz → bin center (dBFS) | H3 target 660 Hz → bin center (dBFS) |
|---|---|---|---|
| balanced-h2-h3 | 222.66 Hz (−16.4) | 457.03 Hz (−24.9) | 667.97 Hz (−32.2) |
| strong-second | 222.66 Hz (−19.2) | 457.03 Hz (−19.1) | 667.97 Hz (−36.9) |
| weak-fundamental | 222.66 Hz (−29.0) | 457.03 Hz (−16.4) | 667.97 Hz (−25.4) |
| second-dominant | 222.66 Hz (−37.1) | 457.03 Hz (−14.6) | 667.97 Hz (−27.6) |
Three patterns show up immediately:
- The fundamental never reports as exactly 220 Hz. It clusters on the 222.66 Hz bin center (~+2.7 Hz offset). That is normal bin snapping, not a tuning error in the file.
- The second harmonic does not label as 440 Hz. Its energy peak sits on the 457.03 Hz bin center (~+17 Hz vs 440). True 440 Hz falls between bin centers at this FFT size; the UI label is the bin center, not the continuous peak frequency you would get from a curve fit.
- The third harmonic is closer in label space: 667.97 Hz vs 660 Hz (~+8 Hz), still not exact.
So the bars track the harmonic series in shape (energy at roughly 1×, 2×, 3×), but numeric PEAK and bar positions follow FFT grid + log bar grouping, not perfect Hz labels on the overtone list.
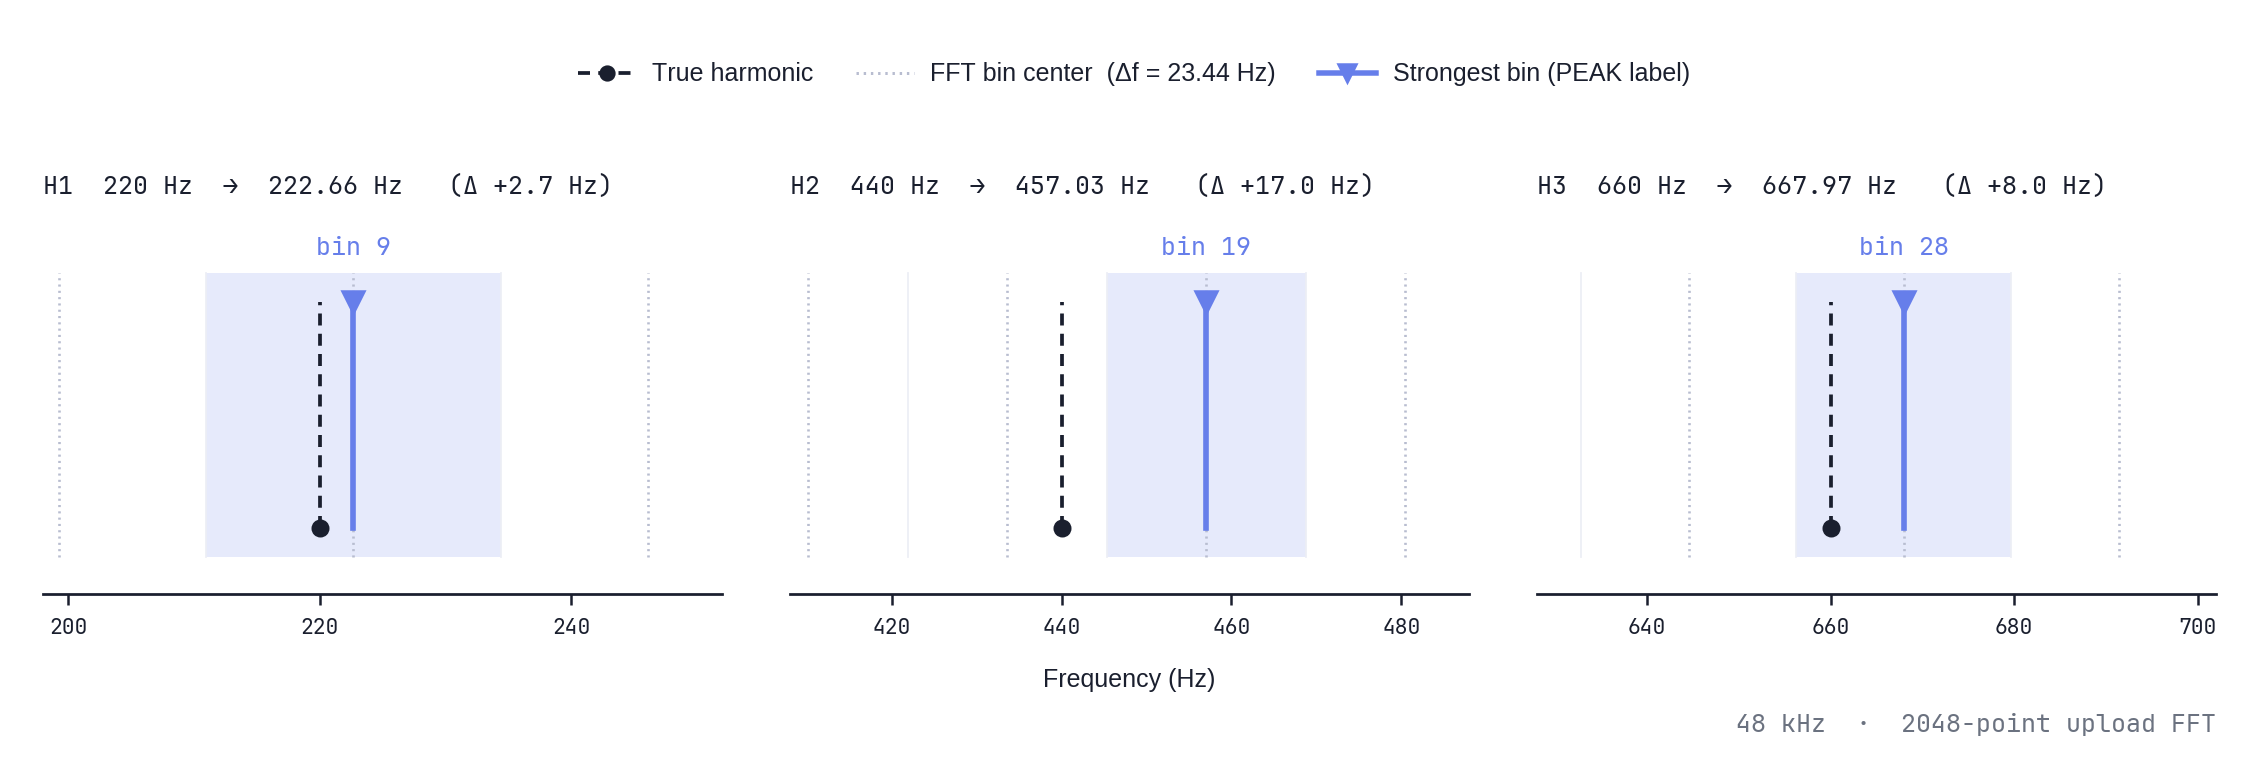
True harmonics at 220, 440, and 660 Hz versus the 2048-point FFT bins used as PEAK labels (222.66, 457.03, 667.97 Hz) at 48 kHz upload analysis
When PEAK names the second harmonic instead of the fundamental
PEAK picks the loudest bin in the band, not “the fundamental by rule.” With the balanced fixture (weak 2nd and 3rd), PEAK reads 222.66 Hz — the fundamental bin wins. As soon as the second harmonic is within a few dB of the first, PEAK jumps to the 457.03 Hz bin:
| Fixture | PEAK (Hz) | LEVEL (dBFS) | CENTROID (Hz) |
|---|---|---|---|
| balanced-h2-h3 | 222.66 | −16.4 | 319 |
| strong-second | 457.03 | −19.1 | 347 |
| weak-fundamental | 457.03 | −16.4 | 472 |
| second-dominant | 457.03 | −14.6 | 485 |
That matches what many singers see on a bright vowel or a close mic: the graph still shows a low stack of bars, but the PEAK chip names an overtone near the second harmonic. It does not mean you “sang an octave high” in pitch-tracker terms; it means more energy landed in that bin for this window. Vocal Pitch Monitor uses autocorrelation on the same upload, not the FFT PEAK, which is why the two tools can disagree in label even on one file — a topic the planned A1 octave-error post addresses directly.
CENTROID shifts upward when upper harmonics dominate (472–485 Hz on the weak-fundamental and second-dominant files) even though the fundamental is still present. CENTROID is a balance meter, not a note name.
Log-scale bars add another layer
Between 80 Hz and 16 kHz, Bar mode does not draw one bar per FFT bin. It divides the log axis into canvas-width bands and, for each band, takes the max dB among bins in that Hz interval. A narrow harmonic can share a bar with its neighbor or look “smeared” if the bar spans several bins. Zooming Low–High (for example 125–2000 Hz for a mid voice check) changes both which bins exist in view and how many bins each bar eats, so the same upload can look sharper or flatter without any change in the audio.
For view-mode behavior, see Bar, Line, and Circle. Peak-hold keeps a recent maximum visible for ~1.7 s; a consonant spike can linger on the graph after the sound itself moved on.
Limits of this experiment
- Synthetic steady tones only. Vowels, formants, breath noise, vibrato, and reverb spread energy across many bins; PEAK can wander frame to frame.
- Upload vs live mic FFT sizes differ (2048 vs 4096). Repeat the WAV test on upload; use live mic for room and performance conditions, not as a pixel match to the JSON table.
- We did not tune Low–High or sensitivity per file. Raising the Spectrum floor can hide weak harmonics and change PEAK without changing your voice.
- Harmonic amplitudes in real singing are not fixed ratios; comparing your voice to these WAVs is about mechanism, not target bar heights.
Repeat the test in MusicalBoard
- Download one WAV above (or all four).
- Open Vocal Pitch Monitor or Vocal Spectrum and upload the file (same analysis backend).
- After analysis finishes, play and pause near the middle second of the tone.
- With Low 80 Hz, High 16 kHz, and default sensitivity, read PEAK and compare to the table. Try 125–2000 Hz and watch how bar density changes.
- Optionally regenerate numbers:
python3 -I scripts/make_spectrum_harmonic_fixture_wavs.pyfrom the project repository.
If PEAK sits near 457 Hz on a file you know is A3, check harmonic balance and FFT labeling before assuming an octave mistake. For mixed recordings where the line jumps register, start with Why Pitch Jumps on a Mixed Vocal and separation on Vocal Isolator.
Bottom line: On a known 220 Hz harmonic series, Vocal Spectrum places energy on the expected regions (1×, 2×, 3×), but reported frequencies are bin centers on a coarse grid, and PEAK follows the strongest bin, which is often the second harmonic when it is loud. That is the tool behaving as designed — useful for comparing takes at the same settings, not for reading exact overtone Hz without context.