When you first open a spectrum analyzer, two things catch your eye: a bar graph stretching across the screen and four numbers updating at the top — PEAK, LEVEL, CENTROID, RMS. Watching them change in real time, it's easy to feel uncertain about what exactly they represent and how they relate to your singing. A spectrum analyzer decomposes sound into its constituent frequencies and visualizes the energy distribution across them. The four metrics in the top panel distill the most important information from that distribution into numbers. This article explains each metric in precise terms, covers the concept of dBFS, describes how the peak hold line works, and walks through how these numbers behave during actual singing. Open MusicalBoard's Vocal Spectrum alongside this article and you can watch everything described here happen in real time.
What the Spectrum Analyzer Shows: FFT and Per-Frequency Energy
Sound is a complex wave — a mixture of many frequencies occurring simultaneously. Unless a signal is a pure sine wave, every real instrument or voice produces dozens to hundreds of overlapping frequency components. A spectrum analyzer separates those components and shows how strongly each frequency is present.
The algorithm that performs this separation is the FFT (Fast Fourier Transform). FFT is a mathematical technique that converts a time-domain signal (a waveform) into the frequency domain. In the resulting graph, the horizontal axis represents frequency in Hz and the vertical axis represents the energy level at each frequency in dBFS.
The default display range in MusicalBoard Vocal Spectrum is 80 Hz to 16 kHz. This range covers the fundamental frequency of the human voice (approximately 80–200 Hz for males, 150–350 Hz for females), harmonics, and the fricative components of consonants (4 kHz–10 kHz). The display range can be adjusted in settings, and a sensitivity slider (0.001–0.1) controls the visibility of weaker signals.
The horizontal axis uses a logarithmic scale because human hearing perceives frequency in ratios rather than absolute differences. Moving from 100 Hz to 200 Hz and from 1000 Hz to 2000 Hz both sound like "one octave up." On a linear scale, the low-frequency region would be compressed into an unreadably narrow strip; the logarithmic scale gives each octave the same visual width.
The four metrics in the Vocal Spectrum top panel summarize the most important information from the current spectrum as numbers.
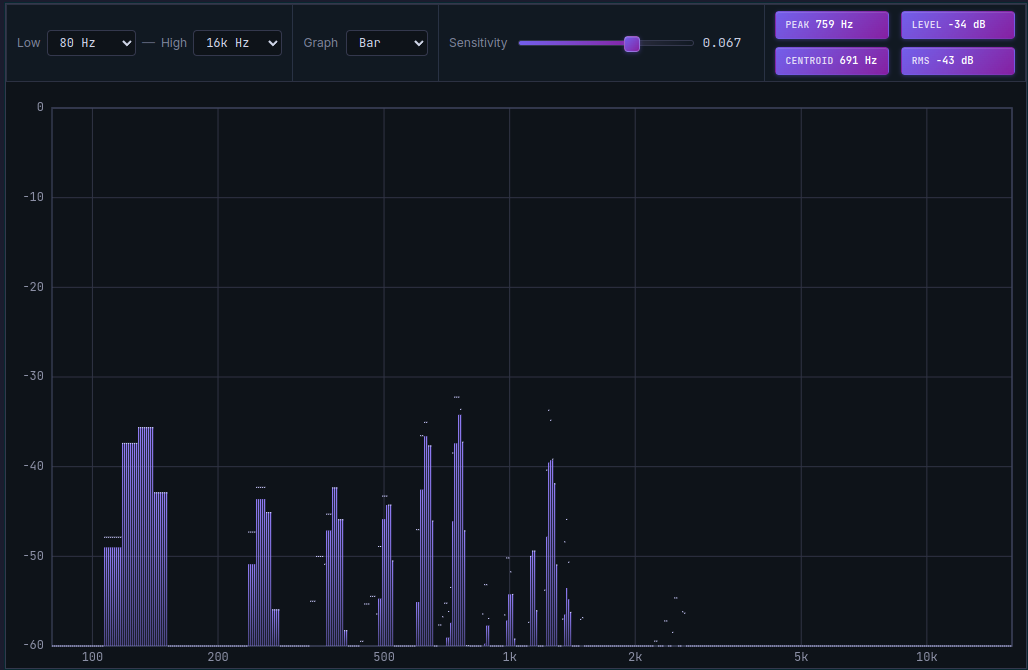
PEAK: The Frequency with the Strongest Energy (Hz)
PEAK displays, in Hz, the frequency that currently holds the highest energy level within the display range (default 80 Hz–16 kHz). In plain terms: "which frequency is ringing the loudest at this exact moment?"
During singing, PEAK typically tracks the fundamental frequency (F0). If you are singing E4 (approximately 330 Hz), PEAK will generally display a value near 330 Hz. As you move to higher pitches, the PEAK value rises; as you move lower, it falls.
PEAK can point to a frequency other than the fundamental. This happens when a particular harmonic overtone is stronger than the fundamental, when the microphone is picking up room reflections or external noise, or when a consonant is being produced — at that moment, the fricative energy of the consonant can temporarily dominate the spectrum, sending PEAK spiking into the high-frequency range.
How PEAK is useful for singers: watching PEAK while singing a melody line gives you a sense of the fundamental frequency range your voice is operating in. If PEAK reads lower than expected, more energy is concentrated in the low register. If it reads higher than expected, upper harmonics or consonant energy are dominating.
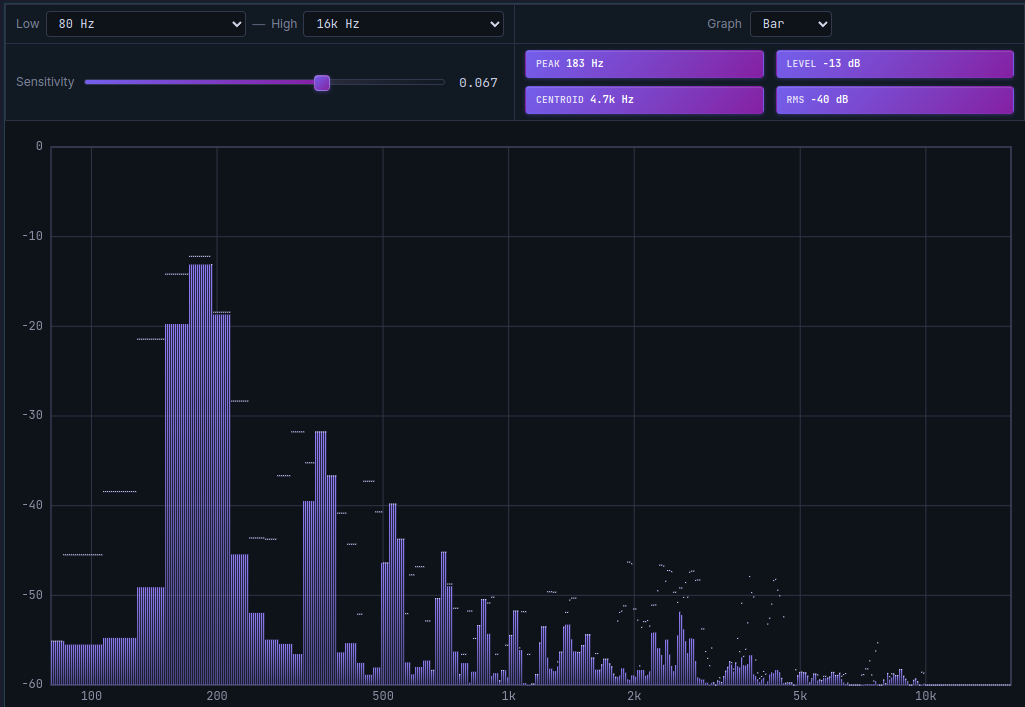
LEVEL: The Energy Level at the PEAK Frequency (dBFS)
LEVEL shows the energy magnitude, in dBFS, at the frequency PEAK identified — that is, at the strongest frequency. If PEAK answers "where is it loudest?", LEVEL answers "how loud is it there?"
A LEVEL value close to 0 dBFS means that frequency carries very high energy. A LEVEL deep in the negatives (for example, −50 dBFS) means the energy there is weak.
Practically, LEVEL serves as a rough check on your microphone input level while singing. If LEVEL consistently approaches 0 dBFS, there is a risk of clipping (digital distortion) — move the microphone slightly farther away or reduce the sensitivity setting. A range of −20 dBFS to −6 dBFS is generally considered appropriate for recording.
Understanding dBFS: 0 Is the Maximum, Negative Values Are Quieter
The vertical axis of the spectrum graph and both the LEVEL and RMS metrics use dBFS (decibels relative to full scale). This is the standard unit for expressing signal levels in digital audio.
- 0 dBFS: The maximum level a digital system can handle. Exceeding it causes clipping (digital distortion).
- Negative dBFS: Any level below the maximum. −6 dBFS is roughly half the amplitude of 0 dBFS; −20 dBFS is a much smaller signal.
- −60 dBFS: Effectively silence. Ambient noise typically registers around this level.
One important concept: dBFS expresses a ratio, not an absolute value. The difference between −6 dBFS and −12 dBFS is 6 dB, which represents roughly a four-fold difference in energy — perceived by the ear as approximately twice as loud. In music production, the master level is generally kept at −6 dBFS to −3 dBFS or below to preserve headroom.
In vocal practice, you don't need to manage dBFS with precision. But understanding that "closer to 0 = stronger signal, larger negative number = weaker signal" lets you read the spectrum intuitively.
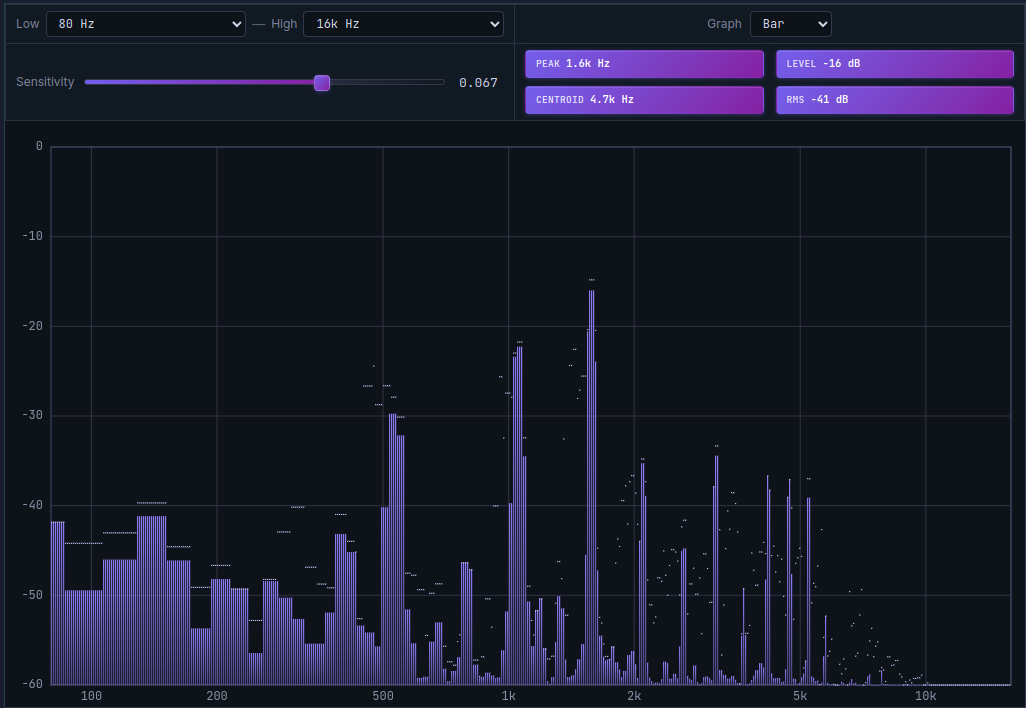
CENTROID: The Energy Center of Gravity of the Spectrum (Hz)
CENTROID is the most distinctive and revealing metric. It shows, in Hz, the frequency at which the entire spectrum's energy is balanced — the point where low-frequency energy and high-frequency energy are in equilibrium.
A high CENTROID means energy is concentrated relatively toward the high-frequency end, which corresponds to a bright, sharp tonal character. A low CENTROID means energy is concentrated in the low-frequency range, corresponding to a dark, rounded sound.
In the field of Music Information Retrieval (MIR), spectral centroid is recognized as a key quantitative measure of tonal "brightness" (Music Information Retrieval — musicinformationretrieval.com).
Here is how CENTROID behaves during singing:
Singing a high note: As the fundamental frequency rises, the harmonics rise with it, shifting the energy center of gravity upward. The CENTROID value increases.
Head voice vs. chest voice: Head voice tends to have relatively stronger upper harmonic content, so even at the same pitch, head voice often produces a higher CENTROID than chest voice.
Bright vowels vs. dark vowels: The "ee" vowel has strong high-frequency energy due to its formant structure, producing a higher CENTROID. The "oo" vowel emphasizes low-frequency energy and tends to produce a lower CENTROID.
Consonant production: Fricatives such as "s," "sh," and "z" concentrate energy in the high-frequency range, causing CENTROID to spike sharply upward.
As pitch rises, the energy center of gravity (CENTROID) moves upward. CENTROID quantifies the brightness of your sound.
RMS: Average Loudness Across the Full Display Range (dBFS)
RMS (Root Mean Square) represents the average energy level across the entire display range in dBFS. In everyday terms: "how loud am I singing right now?" Unlike LEVEL, which shows only the strongest single frequency, RMS integrates the whole spectrum.
A high RMS (close to 0 dBFS) means the voice is producing a strong, energy-rich sound overall. A low RMS (−40 dBFS or below) means the sound is quiet or the voice is not yet registering strongly at the microphone.
In audio engineering, RMS is recognized as the measure that best reflects the perceived loudness of a sound — it more accurately represents how loud something actually sounds than instantaneous peaks do. The broadcast standard LUFS (Loudness Units relative to Full Scale) is an evolution of the RMS concept.
Ways to use RMS in vocal practice:
- Check whether RMS remains consistent throughout a phrase. A sudden drop in a particular passage often signals a loss of breath support or a weakening of tone.
- Compare RMS before and after practicing a phrase on the same pitch — a rising RMS indicates that the voice is generating more energy.
- Play back a recorded take and watch RMS to understand how energy flows through the entire song.
Peak Hold Lines: 1.7-Second Hold, Then Gradual Decay
In the Vocal Spectrum graph, you will see thin lines resting briefly above the bars before slowly descending. These are peak hold lines.
A peak hold line marks the highest energy level recently reached at each frequency, holds that position for 1.7 seconds, and then gradually falls. This gives you a brief visual memory of where strong energy spikes occurred — information that would vanish too quickly to catch if only the real-time bar were displayed.
Peak hold lines are most useful for tracking momentary spikes. They show which frequency band experienced a burst of energy during a consonant, or how high a particular harmonic reached during a sustained note — visible for 1.7 seconds after the event.
A large gap between the peak hold line and the real-time bar indicates an unstable, fluctuating signal. In a stable, well-supported tone, the real-time bar and the peak hold line stay close to the same height.
How Each Metric Looks During Actual Singing
Here is a scenario-by-scenario look at how the four metrics move in real practice.
Singing a low note: PEAK sits near the fundamental frequency (e.g., G2, approximately 98 Hz). LEVEL is around −10 to −5 dBFS with adequate breath support. CENTROID is low, because low-frequency energy dominates. RMS reflects overall volume, typically −20 to −10 dBFS.
Jumping to a high note: PEAK rises sharply. CENTROID rises with it. LEVEL holds if the support is there, but drops if the voice loses energy on the way up. RMS should remain comparable to the low note if the high voice is well-supported; it drops with a weak high note.
Producing an "s" consonant: CENTROID jumps dramatically upward (energy concentrates between 4 kHz and 10 kHz). PEAK also moves into the high-frequency range. RMS can briefly rise during the consonant burst.
Transitioning from chest to head voice (passaggio): CENTROID shifts at the transition point. The rich lower harmonics of chest voice diminish, and the spectral energy redistribution is visible in the graph. If LEVEL and RMS are unstable through the passaggio, the register transition is not yet smooth.
An unstable or wavering tone: PEAK and LEVEL fluctuate rapidly. CENTROID oscillates. The gap between the peak hold line and the real-time bar widens.
Practicing with MusicalBoard Vocal Spectrum
MusicalBoard's Vocal Spectrum starts displaying real-time spectrum the moment you grant microphone permission. No installation or account is required; all audio processing happens on the device.
Here are concrete ways to practice using the four metrics:
Record CENTROID by register: Sing a comfortable low note, a mid-range note, and a high note, and note the CENTROID value for each. Tracking how much CENTROID rises as pitch climbs builds intuitive awareness of how your voice shifts character across registers.
Check RMS consistency across a phrase: Sing through a phrase and watch whether RMS stays relatively stable. A sharp drop in one section points to where breath support or tone needs work.
Adjust microphone distance using LEVEL: If LEVEL approaches −3 dBFS, move back from the microphone. If LEVEL is below −40 dBFS, move closer or increase the sensitivity setting.
Identify sibilance with peak hold lines: After producing "s" or "sh" consonants, note where the peak hold line settles. Persistent strong peaks above 5 kHz are a signal of potential sibilance issues.
Using Vocal Pitch Monitor alongside Vocal Spectrum lets you monitor pitch accuracy and spectral character simultaneously. When PEAK points to the fundamental frequency, cross-check in Vocal Pitch Monitor to confirm that note is in tune. Recording with Singing Recorder and playing back also allows you to review a synchronized spectral history alongside the recording timeline.
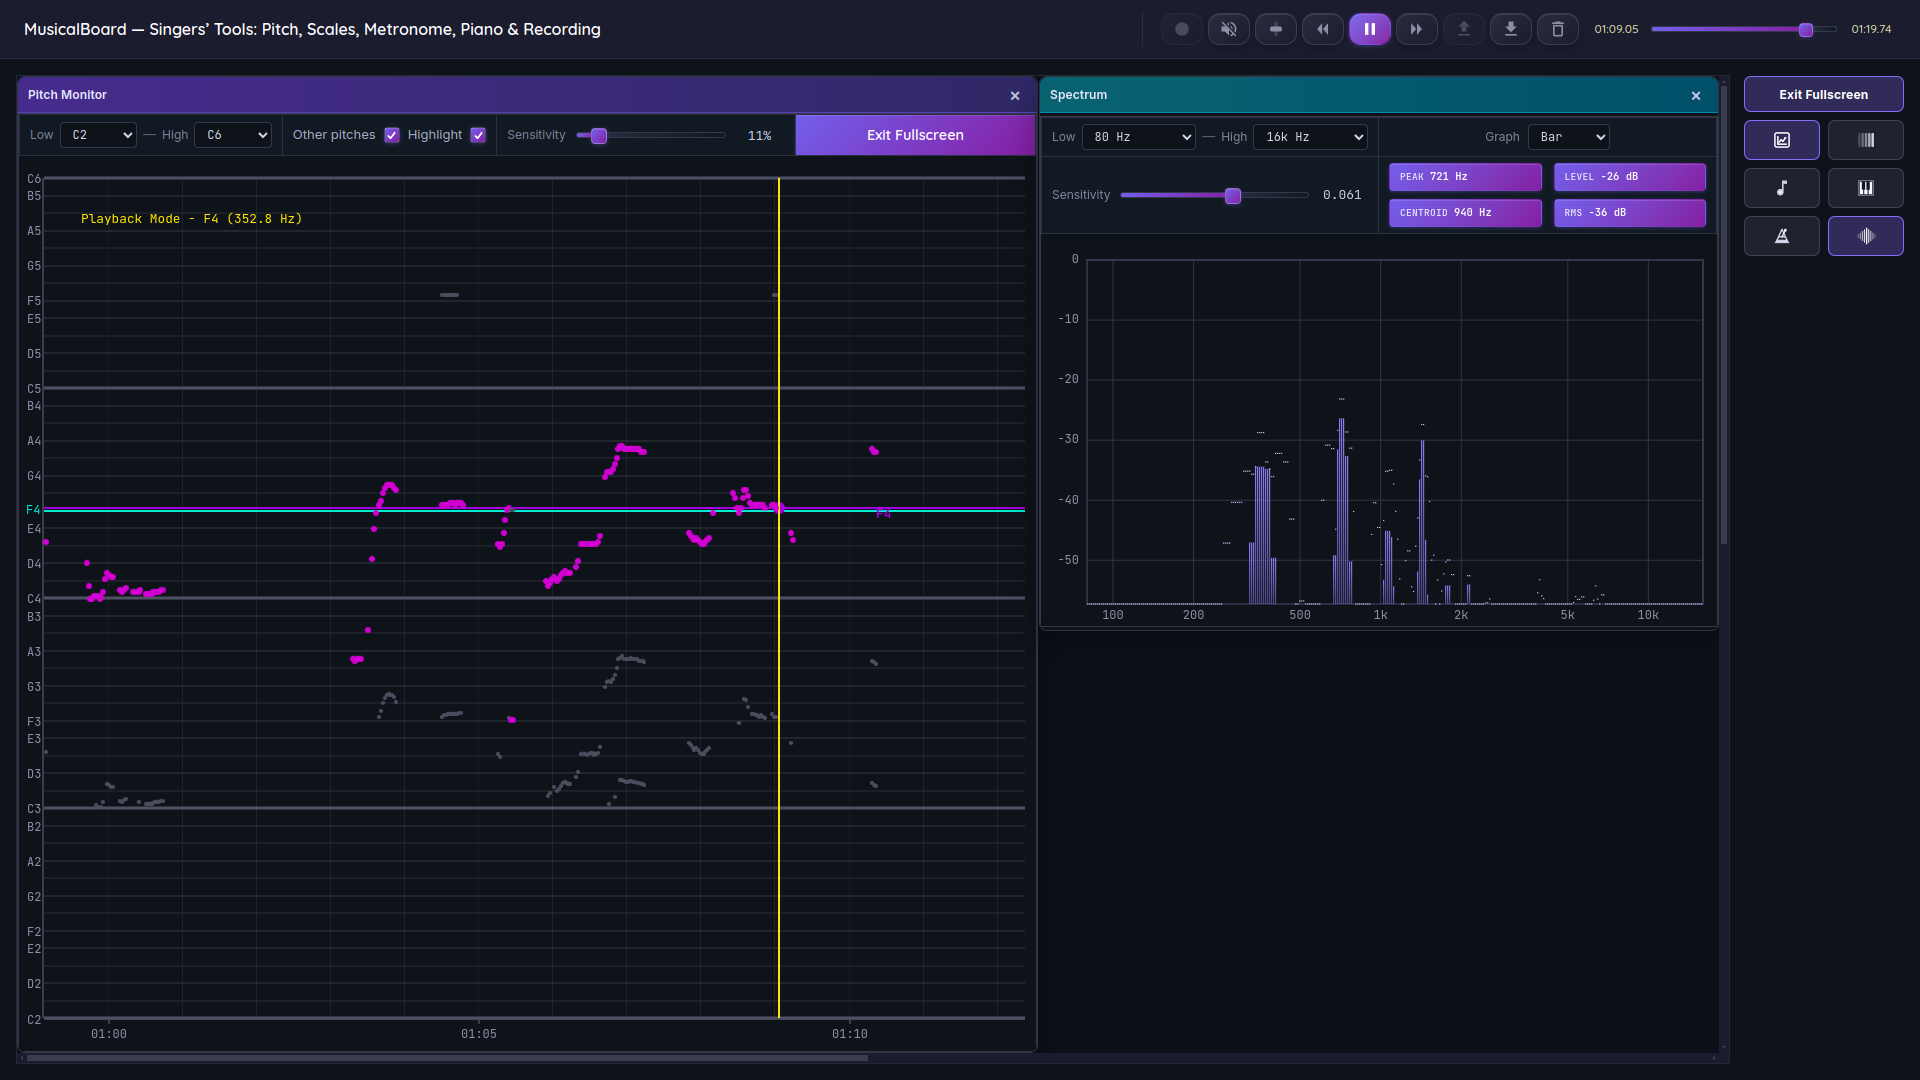
Opening Vocal Pitch Monitor and Vocal Spectrum side by side lets you check pitch accuracy and tonal character at the same time.