Open Vocal Range Test, turn on your microphone, and the chromatic strip begins filling with color while four numbers — SCORE, LIVE, RANGE, and VOICE — update in the upper right. At first glance it can be hard to tell what any of it means. This article explains exactly what each indicator measures, how to interpret the heatmap colors, and how to connect all that data to your actual practice.
What Is a Vocal Range Map?
A vocal range map is a tool that visualizes pitch accuracy and occurrence frequency for each note during a singing session. Arranged like piano keys from low to high in semitone steps, the chromatic strip uses color to show how accurately you sang each note.
The key insight is that instead of simply telling you "your range spans this many octaves," it lets you see which individual notes are on pitch and which are unstable — note by note. That is what separates a vocal range map from an ordinary pitch monitor.
What Is the Chromatic Strip?
"Chromatic" means "constructed in semitone steps." The strip is a horizontal band in which the twelve pitches of one octave — C, C#, D, D#, E, F, F#, G, G#, A, A#, B — repeat across multiple octaves. Vocal Range Test's chromatic strip spans the wide range that the human voice can reach.
Each cell in the strip represents one semitone. When you sing a note, that cell fills with color.
How to Read the Four Indicators
SCORE — Overall Session Pitch Accuracy
SCORE is a composite score of pitch accuracy for every note sung during the current session. It is expressed as a number between 0 and 100.
A score closer to 100 means the notes you are producing land precisely on their target pitches; a lower score means your intonation drifts frequently or is unstable. SCORE stabilizes as more data accumulates over the session. The reliability of a SCORE after only a few notes is very different from one recorded after ten minutes of singing.
Practical interpretation:
- 90 and above: Intonation is very stable. Time to focus on dynamics, tone color, and expression.
- 70–89: Most notes are fine, but some wobble. Find the yellow-to-orange zones in the heatmap and drill them.
- 50–69: Significant instability across many notes. Foundational pitch training is needed.
- Below 50: Developing pitch sense should be the first priority. Starting with drone matching is an effective approach.
Keeping a regular record of your SCORE lets you track improvement as a concrete number — especially when you measure the same song or the same pitch range repeatedly.

The four indicators in the upper right: SCORE (session-wide average), LIVE (current real-time), RANGE (detected pitch range), VOICE (estimated voice type).
LIVE — Current Real-Time Pitch Status
LIVE displays the pitch accuracy of the sound you are producing right now in real time. If SCORE is the session's overall average, LIVE is a snapshot of the present moment.
A high LIVE value while you hold a note means you are nailing it; a low value means you are drifting away from the target. As the note stabilizes, the LIVE value stabilizes with it.
How to use it:
Try sustaining a specific note while watching the LIVE indicator. The higher LIVE stays, the more steadily you are holding the pitch. If LIVE starts low and climbs after the note begins, your note entry is unstable; if it fluctuates while you sustain, your breath support is insufficient.
When using vibrato, periodic rises and falls in LIVE are normal. The vibrato center — its pitch center — should sit on the target note so that the average LIVE value stays high.
RANGE — Lowest to Highest Note Detected in the Session
RANGE shows the lowest and highest notes the microphone detected during the session. A display reading "C3 ~ A4," for example, means you sang notes spanning from C3 to A4 in that session.
Beyond simply measuring your range, logging RANGE after each session lets you track how your range shifts over time. Comparing RANGE on good voice days versus difficult ones also helps you understand your voice's variability.
Important caveat:
RANGE includes every pitch where sound was detected, regardless of accuracy. A strained high note or an out-of-tune pitch can still register in RANGE. Think of RANGE not as a ceiling of what you "can" sing, but as "the range detected during this session."
Your practical working range (tessitura) is not the full RANGE but the segment of the heatmap that fills in solid green.
VOICE — Estimated Voice Type
VOICE displays the voice type estimated from the RANGE detected in the session — classifications such as soprano, mezzo-soprano, alto, tenor, baritone, and bass.
An important limitation:
Voice type classification is not determined by range alone. Traditional classical voice classification weighs range alongside timbre, the passaggio (the register break between chest and head voice), volume, and tessitura (the range where the voice is most comfortable). The VOICE indicator is a quick reference based solely on range data.
Even if VOICE reads "baritone," you may in fact be a high tenor; conversely, a soprano who has not yet reached her lower notes might be classified as "alto." Treat this indicator as a rough guide only — a voice teacher is the right resource for an accurate voice type determination.
The Two Channels of the Heatmap — Accuracy and Frequency
How each cell in the chromatic strip is colored and how intensely it fills can be read along two dimensions.
Accuracy Channel
This reflects how closely your pitch matched the target for each note. The closer you were to the note's center frequency, the more favorable the color (green); the further away, the more unfavorable (red).
- Green: On target. Pitch is stable and well-centered.
- Yellow–Orange: Slightly off. You are producing the note but landing a little flat or sharp.
- Red: Significantly off target. Pitch is wandering considerably on this note, or it is being recognized as a neighboring pitch.
Frequency / Density Channel
This reflects how often each note appeared, encoded in color intensity. A darker shade of green means you sang that note frequently and accurately. A thin, pale shade means you only passed through it briefly or sang it once.
You need both dimensions together for the heatmap to be meaningful. Dark green means "sung often and accurately." Light green means "accurate but not sung much." Bright, intense red means "you hit this note often but intonation was consistently off" — a clear signal for targeted work.
Reading Colors on the Chromatic Strip — In Practice
After a session, scan the full strip and note these patterns.
1. The darkest green zone = your current tessitura
Where the dark green clusters is where your voice is most stable and natural today. Use this as your reference point for song selection and for setting practice keys.
2. Yellow / orange zones = your next practice targets
The yellow and orange zones between green and red are "almost there but still unstable" notes. Focused work on these zones tends to convert them to green relatively quickly.
3. Red zones = limit notes or weak spots
Red at the edges of your range marks notes near your current ceiling or floor. Rather than forcing them, expand gradually through vocal technique training. Red in the middle of your range points to a specific technical weak spot that needs targeted drilling.
4. Empty cells = notes not yet attempted
Completely empty cells mean those notes were not detected in this session. Deliberately include them in your next session to fill in the map.
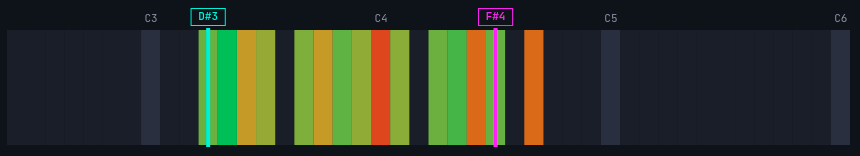
Dark green = note sung often and accurately. Yellow / orange = slightly unstable. Red = significantly off pitch. Empty cells = notes not yet attempted.
Practical Application — Identifying Weak Notes and Setting Practice Priorities
Once you have read the heatmap and the four indicators, it is time to connect them to your practice.
Step 1: List Your Weak Notes from the Heatmap
Note down any notes showing heavy red or orange. If F#4, G4, and G#4 are orange, those are your currently unstable zone.
Step 2: Targeted Scale Drills
Open Vocal Scales and choose a scale that includes your weak notes, then open Vocal Pitch Monitor to watch real-time pitch as you practice. Observe where the pitch graph wavers around F#4, G4, and G#4, and adjust your breath, posture, and vowel shape accordingly.
Step 3: Drone Locking on a Specific Note
Choose one of your weak notes and press it on Virtual Piano to sustain the tone. Match it with an "aah" or "ee" vowel and repeat. Keep Vocal Pitch Monitor open at the same time to confirm that your voice is landing precisely on the drone.
Step 4: Re-measure to Confirm the Change
After focused practice, run Vocal Range Test again. You may see a previously orange cell turn green, or your SCORE climb. Seeing that change reinforces the value of your effort and sustains motivation.
Step 5: Range Extension Practice
Check the yellow and orange cells near the edges of your RANGE — the notes just above your current highest pitch or just below your lowest. As these cells gradually turn green, your practical usable range has expanded. Rather than forcing notes, work through vocal technique so that edge notes stabilize naturally over time.
Using It with a Metronome
If you want to train pitch and rhythm simultaneously, keeping Online Metronome open alongside is very useful. Sing scales containing your weak notes in time with the metronome click while Vocal Range Test fills in the heatmap for each note. Once intonation is stable at a slow tempo, gradually raise the BPM to practice maintaining the same accuracy at faster tempos.
Building a Habit of Logging Session Data
Vocal Range Test's indicators persist only within the session. Refreshing the page resets them. If you want to track your own data over time, you need to record it manually.
A simple approach is to log the following in a notebook or spreadsheet:
- Date
- SCORE value
- RANGE (lowest to highest note)
- Weak notes noticed today
- Practice conditions (voice health, weather, whether you warmed up beforehand)
Comparing this data over two-to-four-week periods makes visible the trend in your SCORE, shifts in your range, and the progress of specific weak notes improving. Seeing growth in numbers is a powerful motivator for keeping up consistent practice.
Practicing with MusicalBoard Vocal Range Test
Vocal Range Test requires only a microphone permission grant in your browser — no installation, no login. Here is how to run your first session:
- Allow the microphone and warm up for a few minutes (humming, lip trills, etc.).
- Start in your comfortable middle range, then explore slowly downward and then upward.
- Sustain each note for 2–3 seconds on an "aah" vowel and watch the heatmap fill in.
- When the session ends, note your SCORE, RANGE, and VOICE, then review the full heatmap.
- Identify your yellow and orange zones and plan your next practice session.
Running Vocal Range Test regularly lets you move beyond a simple "my range is X octaves" answer to a systematic understanding of which notes are stable and which are not. That is the difference between repeating songs aimlessly and practicing with data.
References
- Voice type — Wikipedia
- Tessitura — Wikipedia
- Vocal range — Wikipedia
- How to Find Your Vocal Range — School of Rock
- Pitch Detection Algorithm — Wikipedia
- Web Audio API — MDN Web Docs