Relying on your ears alone to understand "where your voice is" while you sing has its limits. You can check your pitch with Vocal Pitch Monitor, but a pitch graph alone won't tell you what the harmonic structure of that note looks like, or which frequency range your energy is concentrated in. Vocal Spectrum is the tool that shows you what's happening on the inside. This article walks through what a spectrum actually is, how to read the graph, and some specific, practical ways to put it to use in your practice.
What the Spectrum Shows — "Sound Within Sound"
When you sing a single note, what travels through the air isn't just one frequency. Alongside the fundamental pitch (F0), a series of overtones at integer multiples — 2×, 3×, 4×, and so on — ring out simultaneously. These are called harmonics.
Take a tenor singing C3 (131 Hz). On the spectrum graph, you'd see the tallest bar sitting at 131 Hz, followed by smaller bars lined up at 262 Hz, 393 Hz, 524 Hz, and beyond. The height pattern of those bars is essentially what we mean when we talk about the "color" or "timbre" of a voice.
A spectrum analyzer uses an algorithm called FFT (Fast Fourier Transform) to break this harmonic structure apart and plot it on a graph in real time. The horizontal axis shows frequency (Hz), and the vertical axis shows the energy level at each frequency (dBFS). As you sing, you can literally see which frequencies carry energy and how much.
In a spectrum graph, the tallest bar on the far left is the fundamental. The progressively shorter bars to its right are the harmonics.
Reading the Two Axes
The Horizontal Axis — Why Frequency Uses a Logarithmic Scale
Most vocal spectrum tools display the horizontal axis on a logarithmic scale. It's intuitive enough that left = low and right = high, but the uneven spacing is there for a reason.
Human hearing perceives frequency changes as ratios, not absolute Hz differences. Going from 100 Hz to 200 Hz sounds exactly like "one octave up" — and so does going from 1000 Hz to 2000 Hz. If the axis were divided into equal Hz intervals, the low-frequency range that matters most for vocal practice would get compressed into almost nothing. The log scale spreads out the lower and middle frequency ranges so they're actually readable.
Vocal Spectrum shows a default range of 80 Hz to 16 kHz, with guide lines at 125 Hz, 250 Hz, 500 Hz, 1 kHz, 2 kHz, 4 kHz, and 8 kHz. When you're starting out, those lines are the easiest reference points to anchor yourself to.
The Vertical Axis — dBFS, Where Higher Means Stronger
The vertical axis is measured in dBFS (decibels relative to full scale), where 0 is the maximum and values get weaker as you go down. Around −60 dBFS is close to silence.
A bar reaching near 0 means that frequency is carrying a lot of energy right now. A bar sitting low on the graph means that frequency is barely present in your voice. When a note feels quiet, you'll see the bars drop across the board — which makes sense.
Key Things to Watch in a Vocal Spectrum
Harmonic Pattern — Are the Bars Evenly Distributed?
In a well-supported sound, you'll generally see the bars decrease gradually and somewhat evenly from left to right — starting from the fundamental and stepping down with each successive harmonic. If one particular harmonic is jutting up way above the others, or if the spacing is erratic, it can be a sign that something in your technique is out of balance.
Try sustaining a note and watching whether the bars hold their position without much movement. Stable phonation keeps the harmonic bars fairly steady. If you're tense or your voice is wavering, the bars will keep shifting around.
Singer's Formant — Energy in the 2500–3000 Hz Range
One of the most consistently observed features in trained singers is something called the singer's formant. According to the Stanford Center for Computer Research in Music and Acoustics (CCRMA), trained singers produce a pronounced energy peak at around 2500–3000 Hz that persists regardless of vowel or pitch (CCRMA Singing Acoustics). That peak is what gives a singing voice its "ring" and carrying power.
In practical terms, it's worth keeping an eye on whether the bars in the 2–3 kHz range are coming up to a healthy level. Try varying your approach on the same pitch — shifting the larynx position slightly, swapping vowels — and watch how that region responds. It's a useful way to physically discover what produces resonance in your own voice.
Chest-to-Head Voice Transition — Watching the Spectrum Shift
At the passaggio — the transition zone between chest voice and head voice — the harmonic structure itself changes. As the vocal folds thin out and vibrate differently, the distribution of energy across the spectrum shifts visibly in that moment.
This is one of the harder things to catch by ear alone. Even when you feel like you've made a smooth transition, the spectrum might show a particular harmonic suddenly dropping or spiking. Conversely, when the shift is genuinely smooth, the changes in bar height are more gradual.
So practicing the notes around your passaggio while watching the spectrum is worthwhile. The less the bar pattern lurches, the more evenly the transition is actually happening — and now you have visual confirmation of it.
Sibilance — Spikes in the High-Frequency Range
Consonants like 's', 'z', and 'sh' generate sharp spikes in frequencies above 5 kHz. That's sibilance.
If recordings of your voice sound harsh or piercing on those consonants, check the spectrum around 6–10 kHz to see how high those spikes are climbing. You can then experiment — pulling the mic back a little, angling it slightly off-axis, adjusting how you articulate the consonant — and use the spectrum to see whether the spikes come down.
If the region above 10 kHz stays consistently elevated throughout your singing, there's a good chance the microphone is picking up too much breath noise. Try increasing the distance between your mouth and the mic, or repositioning the pop filter.
Practicing with Vocal Spectrum
Vocal Spectrum starts showing you a real-time spectrum the moment you turn on the microphone. Nothing to install — and all audio processing happens locally on your device.
Here's a quick rundown of what you'll see on screen:
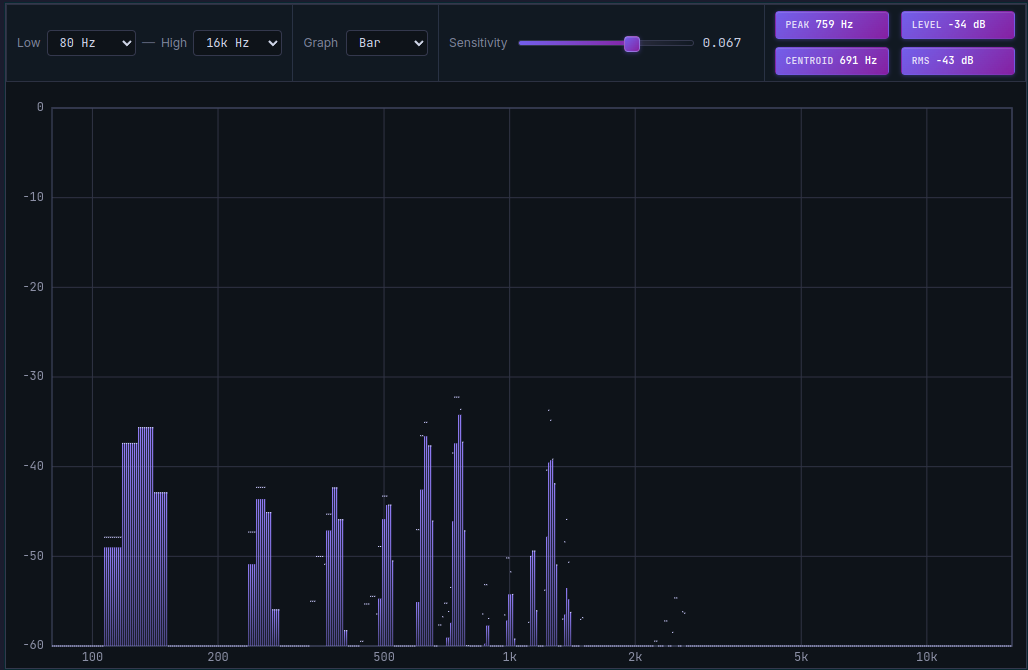
Top panel readouts
- PEAK: The frequency (Hz) with the strongest energy within the displayed range
- LEVEL: The energy level at that frequency (dBFS)
- CENTROID: The "center of gravity" of the energy — higher values tend to correspond to a brighter sound, lower values to a darker one
- RMS: The overall average loudness level across the displayed range
Graph styles You can switch between Bar, Line, and Circle views. Bar is the most intuitive for looking at harmonic patterns. Line gives a smoother picture of the overall energy curve if that's what you're after.
Sensitivity slider In a quiet room recording at low volume, cranking up the sensitivity helps weaker signals show up clearly. In a noisier environment, pulling it back reduces the background noise bars so the signal is easier to read.
If you're running Singing Recorder at the same time, your recorded spectrum history syncs with the playback timeline. That means you can scrub back to any specific moment and review what the spectrum looked like right then.
A Short Practice Routine — Ways to Actually Use the Spectrum
- Build a baseline: Sustain a comfortable note and watch the spectrum. Get familiar with where your harmonic bars tend to sit and how tall they are.
- Work the passaggio: Slide from chest into head voice on a scale and watch for the moment the bar pattern gets unstable. Drill that specific note.
- Check your consonants: Sing through a phrase and see how high the high-frequency spikes get on certain consonants. If sibilance looks severe, adjust your articulation or mic position and compare.
- A/B compare: Record the same phrase twice, then use the playback timeline in Singing Recorder to switch back and forth and compare the spectrums directly.
The Spectrum vs. Your Ears — Which One Do You Trust?
The spectrum graph gives you numbers, but it doesn't define what "good" sounds like. There's no single correct spectral shape. Pop, musical theatre, and classical singing each call for different energy distributions — and even within genres, different songs have different tonal requirements.
The most realistic way to use the spectrum is to decide with your ears what you're aiming for first, then pay attention to what the spectrum looks like when you get there. Once you have that, you can consciously try to reproduce that same pattern next time. The spectrum becomes a mirror — not to tell you what good is, but to tell you whether you're moving in that direction right now.
If you want to check pitch accuracy alongside everything else, leaving Vocal Pitch Monitor open next to the spectrum is useful. Seeing whether pitch instability and spectral turbulence coincide can help you figure out the root cause. And if you haven't done it yet, taking a Vocal Range Test first is a good way to get your bearings before diving into spectral analysis.
You don't need to analyze the spectrum every time you sing. But when something feels off on a particular note, or when your voice has changed and you can't figure out why, the graph can surface information that's genuinely hard to access by ear alone.