Open a browser tab, allow microphone access, and the moment you start singing, a note name and pitch graph appear on screen. No app installation required. How does that actually work? This post walks through the technology behind MusicalBoard's Vocal Pitch Monitor — Web Audio API, AudioWorklet, and WebAssembly — step by step. By the end, you'll be able to answer practical questions like "why do I need to raise the sensitivity?" or "why does it track better in a quiet room?" on your own.
From microphone to graph: the path a signal travels
When you start singing, the browser goes through several steps to turn a microphone signal into a note name. Broadly speaking:
- Microphone access request —
getUserMedia({ audio: true }) - Audio context creation — spins up the browser's internal audio processing engine
- Audio analysis node connection — pulls waveform data in real time
- Pitch detection algorithm — calculates the fundamental frequency from the waveform
- MIDI number conversion and display — maps the frequency to a note name (e.g. A4 = 440 Hz) and draws it on the graph
The entire process happens inside your device without a single round-trip to a server. You can disconnect from the internet while the tab is open and pitch detection will keep working just fine.
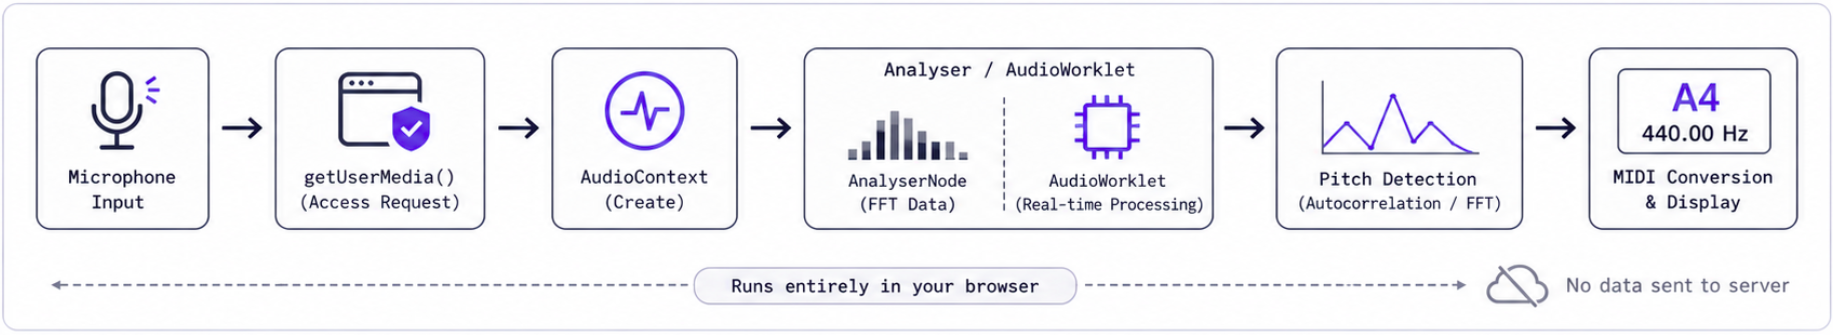
How a microphone signal gets turned into a note name inside the browser. Nothing is sent to a server.
Web Audio API — the browser's built-in audio engine
Web Audio API has been a browser standard since W3C began standardizing it in 2013, and today Chrome, Firefox, Safari, and Edge all support it reliably. The core idea is straightforward: connect nodes together to build an audio graph.
For pitch detection specifically, you take the microphone stream as a source node and attach an AnalyserNode to it. The AnalyserNode lets you pull waveform data (getByteTimeDomainData) or frequency spectrum data (getByteFrequencyData) from the current audio buffer in real time. On MusicalBoard's Vocal Spectrum page, that frequency data is rendered as FFT bars on a logarithmic Hz axis and dBFS scale, which makes vocal-band energy changes easier to read in practice.
That said, AnalyserNode alone isn't great at extracting a precise fundamental frequency from a vocal signal. FFT (Fast Fourier Transform) breaks a signal down into frequency bins, but a human voice — rich with harmonics — doesn't sit cleanly in a single bin. That's why you need a dedicated pitch detection algorithm on top of it.
What "calculating" a pitch actually means — autocorrelation and FFT
There are two common approaches to pitch detection.
Autocorrelation works by sliding a copy of the waveform along the time axis and measuring how closely it matches the original at each offset. The lag where the similarity peaks corresponds to the waveform's period, and the inverse of that period is the fundamental frequency. It's intuitive, not too hard to implement, and shows up in a lot of introductory examples. It handles simple sine waves and single instrument notes reasonably well, though accuracy can degrade with background noise or mixed signals.
FFT-based methods transform the signal into the frequency domain and look for where energy concentrates. These tend to be more robust with complex signals, and when combined with harmonic-aware algorithms like YIN or MPM, they can significantly improve vocal pitch accuracy.
Either way, there's real computational weight here. Updating pitch at 60 FPS means finishing one frame's worth of calculations every ~16.7 milliseconds. Running that on the JavaScript main thread will make your UI stutter. That's where AudioWorklet and WebAssembly come in.
AudioWorklet — audio processing off the main thread
The older Web Audio API had something called ScriptProcessorNode that let you process audio directly in JavaScript — but it ran on the main thread. Heavy audio computation would bog down the whole page, and a busy UI could chop up the audio.
AudioWorklet was introduced to fix that. Audio processing code runs on a dedicated thread, completely separate from the main thread handling your UI and rendering. It receives audio buffers 128 samples at a time, processes them continuously, and sends results back to the main thread via a message channel.
Simplified, the structure looks like this:
[Microphone stream]
     ↓
[AudioWorkletNode] ← created and controlled on the main thread
     ↓ (128-sample blocks passed to dedicated thread)
[AudioWorkletProcessor] ← runs on the audio thread
     ↓ (results sent back via postMessage)
[Main thread UI update]
The reason tools like MusicalBoard's Vocal Pitch Monitor can draw a smooth, continuous graph while you sing is that the audio math never competes with UI rendering for the same thread.
WebAssembly — near-native speed inside the browser
You can absolutely write autocorrelation or FFT calculations in plain JavaScript and have them run. But if you want to use more sophisticated algorithms (YIN, MPM, etc.), track multiple frequencies at once, or make things run smoothly on lower-end devices, you need headroom.
WebAssembly (WASM) is a binary format that lets you run code written in C, C++, Rust, and similar languages inside the browser. It executes at a much lower level than JavaScript, which makes a real difference for compute-heavy tasks. There have been benchmark comparisons where a pitch detection FFT algorithm compiled to WASM from Rust ran roughly 8× faster than the equivalent pure JavaScript implementation.
In MusicalBoard's case, a WASM module runs inside the AudioWorklet thread, receives audio buffers, processes them, and hands back frequency and amplitude data — which then gets drawn as the pitch graph on a canvas element.
What the sensitivity slider actually does
The Vocal Pitch Monitor has a Sensitivity slider in the top settings bar, adjustable from 0.001 to 0.1. What exactly is it controlling?
The sensitivity value feeds into a calculation that sets the minimum relative amplitude a signal needs to be recognized as a valid pitch for that time slice. Turn sensitivity down (toward 0.001) and the threshold rises — only strong, clear signals show up on the graph. Turn it up (toward 0.1) and quieter signals get through, so the graph fills in more readily when you're in a softer environment or singing with less volume.
Put simply, sensitivity controls how aggressive the noise filter is. In a quiet practice room you can safely push it higher. With a lot of background noise, keeping it lower cuts down on spurious dots from sounds you didn't intend to capture.
The logarithmic Y axis — why semitones look evenly spaced
Looking at the pitch graph, the gap between C3 and C4 appears equal to the gap between C4 and C5. In actual frequency terms, C3 is around 130 Hz, C4 around 262 Hz, and C5 around 523 Hz — each octave doubles the frequency. The reason they look equal on screen is that the Y axis uses a logarithmic scale.
An octave up is always exactly 2× the frequency. Human hearing also perceives pitch logarithmically, which is why a log-scale Y axis makes musical sense: every semitone takes up the same visual height, and note labels are distributed evenly. The conversion formula between MIDI number and Hz (440 * 2^((midi-69)/12)) is the direct mathematical expression of that relationship.
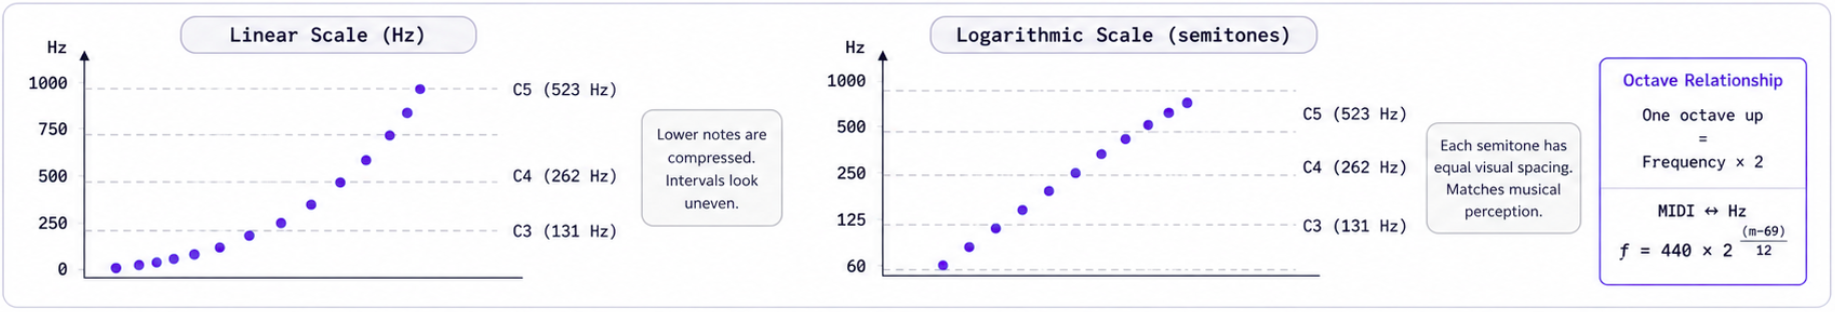
On a logarithmic Y axis, semitone intervals are visually equal — the graph matches musical intuition.
How knowing this changes your practice
A bit of technical background goes a long way in getting better results out of the tool.
If dots on the graph are sparse or intermittent, your sensitivity is probably too low, the microphone is too far away, or background noise is masking your signal just enough that the algorithm won't accept it as valid. Try nudging sensitivity up one step, or move a little closer to the mic.
Leaving "Other pitches" on shows detected harmonics and resonance frequencies alongside the fundamental for each time slice. Vocals are harmonic-rich, so this can be useful when analyzing complex passages or mixed chest/head voice. If the graph feels visually cluttered, just switch it off.
With "Highlight" enabled, the last stably detected pitch stays visible as a reference line for a few seconds. That's why it doesn't disappear the instant you take a breath or pass through a consonant — it gives you a visual anchor to come back to.
You can drag the timeline to review a specific moment after you've sung through a phrase. Double-clicking returns you to auto-follow mode. All of this state management — the timeline position, your settings, your recording data — lives entirely in your browser's local memory and storage. Nothing leaves your device.
Practicing with MusicalBoard
Vocal Pitch Monitor is the most direct place to see this whole technical stack in action. Start singing and your note name and pitch graph appear in real time; when you're done, you can play back the same timeline and review it. Settings like sensitivity and Y-axis range are saved automatically in your browser so they're waiting for you next time.
If you want spectrum context alongside pitch information, Vocal Spectrum shares the same microphone pipeline and opens in the same interface. It is especially useful for reading harmonic balance, register-shift patterns, sibilance peaks, and breath-noise bands while you monitor pitch separately in the graph. For scale practice you can run Vocal Scales alongside it, and Virtual Piano is there when you need to find a reference pitch.
Technically it's a lot of moving parts. From where you're sitting, it's just one browser tab.